
Volatility & Derivatives
In this post we give an introduction to the Heston model which is one of the most used stochastic volatility model. It assumes that the

Greeks are used to understand and manage the different dimensions of risk involved when trading options. With a second order Taylor expansion of the option value over a short time interval, we can decompose the change of the price of the option with first order greeks on the first line, and most important second order greeks on the second one.
The directional exposure, measured by the delta of the option can be managed by trading the spot while the volatility exposure, measured by the vega, can be managed by trading other options.
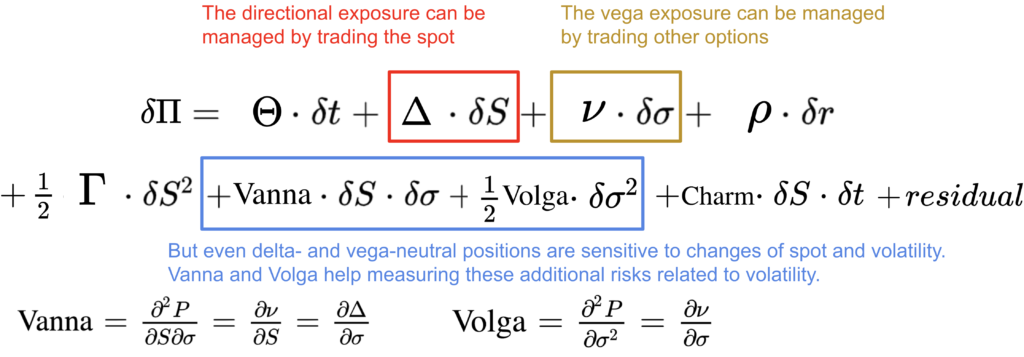
But even if a position is delta- and vega-neutral, it remains sensitive to spot and volatility changes.
The second order greeks vanna and volga help measuring these additional risks related to volatility.
The vanna measures the option’s sensitivity to small changes in the underlying asset price and volatility. It is the sensitivity of the delta to changes in the volatility or the sensitivity of the vega to changes in the underlying asset price.
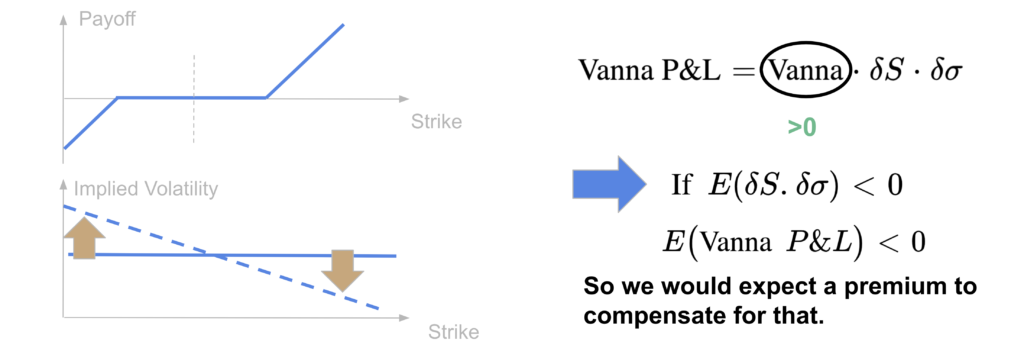
The vanna risk is particularly important to consider when there are important movements of both the underlying asset price and the implied volatility. This comes with an asymmetry of the return distribution. Typically, in the stock market, the volatility is in general negatively correlated with stocks, and the return distribution is negatively skewed, with more tail risk on the downside than on the upside. An important fall of the stock market comes in general with an increase of the implied volatility. So a portfolio with a positive vanna could be exposed to losses in such scenario.
The volga or vomma measures the sensitivity of the vega to a change in the implied volatility. It is the second order partial derivative of the price of the option with respect to the implied volatility.
The volga risk is associated to the risk of important movements of the implied volatility, so to the volatility of volatility, or vol of vol risk. A higher vol of vol means more risk to have important price movements both on the downside or on the upside, so more tail risk on both sides.
While both long call and put options have a positive vega, a higher volatility meaning a higher price, the vanna is positive in general for out-of-the-money (OTM) call option and negative for an OTM put option.
When the option is very OTM, its delta decreases in absolute value and tends to zero, particularly when the option becomes close to expiry. As the implied volatility increases, the probability that the option moves ITM and that the delta becomes more positive for call options and more negative for put options increases. So a higher volatility means a higher delta for an OTM call and a lower delta for an OTM put.
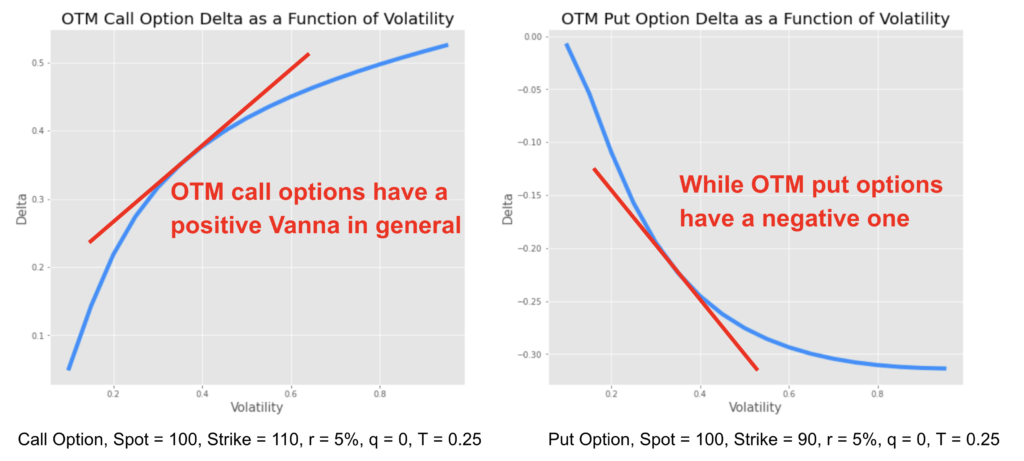
This is exactly the opposite for in-the-money (ITM) options. The delta of an ITM call will tend to have a negative sensitivity to volatility while the delta of an ITM put will tend to have a positive one.

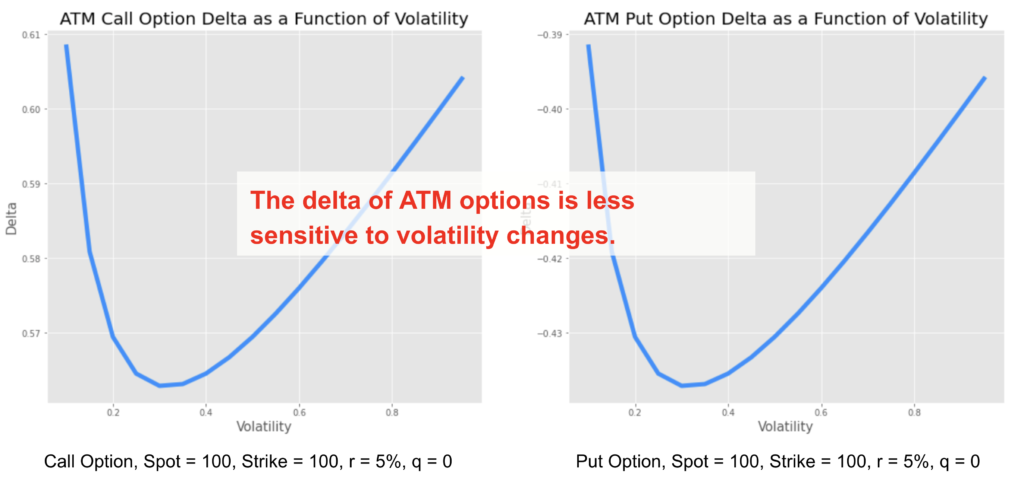
When the option is at the money its delta becomes less sensitive to changes in volatility meaning a lower vanna in absolute value.
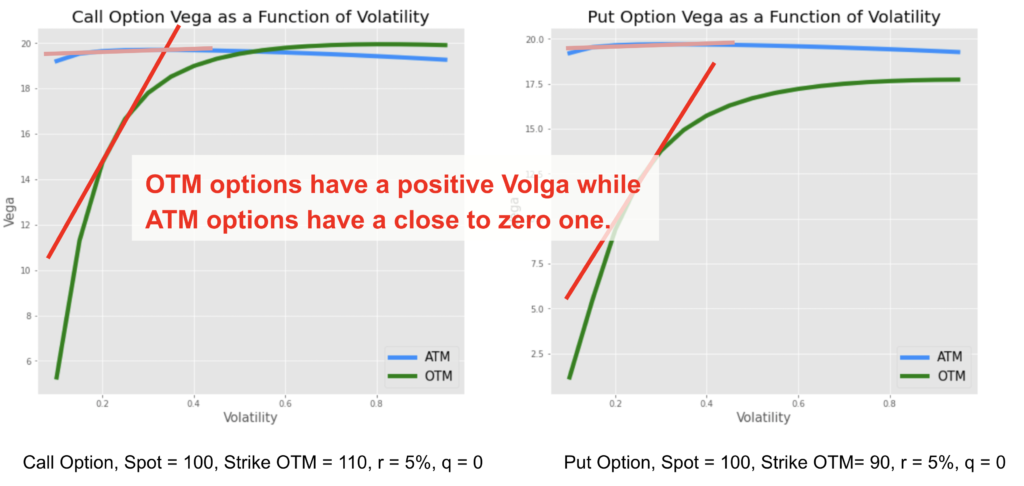
When looking at the sensitivity of the vega to changes in volatility, the vega of ATM options is not sensitive to volatility changes meaning a close to zero volga while OTM put or call options have a positive one, the vega increases with volatility. The volga risk, or vol of vol risk is attributed to the wings.
The vega is higher for ATM options than OTM ones. However, an OTM option will be more similar to an ATM one when the implied volatility increases, as it becomes more likely to be exercised. So the vega of an OTM option increases with implied volatility, meaning a positive volga.
If we consider a long OTM call option position, it has a positive vega, a positive vanna and a positive volga while a short OTM put option has a negative vega, still a positive vanna and a negative volga.
So a long risk-reversal strategy would have quite a low vega and volga, i.e. a low sensitivity to volatility at the first and second order, but it would have a positive vanna. The strategy will still be exposed to the opposite co-movement of spot and volatility.
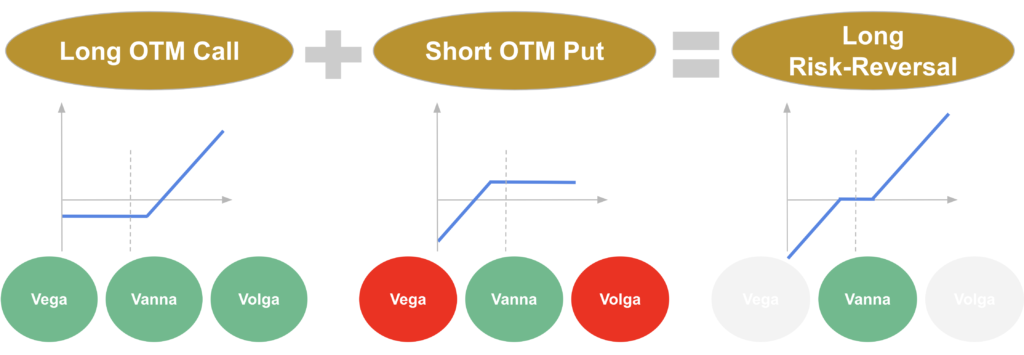
So we see that a risk-reversal strategy is strongly related to vanna risk. If we assume as well that the spot and the volatility are negatively correlated, then the expected vanna P&L of a long risk-reversal strategy would be negative. So we would expect a positive premium to compensate for that.
It is a simple way to understand why a negative spot / vol correlation would create a negative implied volatility skew, with a higher price for OTM puts that the strategy is short and a lower price for OTM calls that the strategy is long.
Now if we consider a long straddle position, so a long position on ATM call and put options on the same underlying asset with the same expiry date, It has a positive vega, as both the long call and the long put have a positive vega exposure, but it has a quite low vanna and a low volga as both options are ATM.
On the other hand, a short strangle position will have a negative vega, but also a negative volga as both options are OTM, both the short OTM call and the short OTM put options have a negative volga. It still has a low vanna, an important part of the negative vanna of the short call will be offset by the positive vanna of the short put.
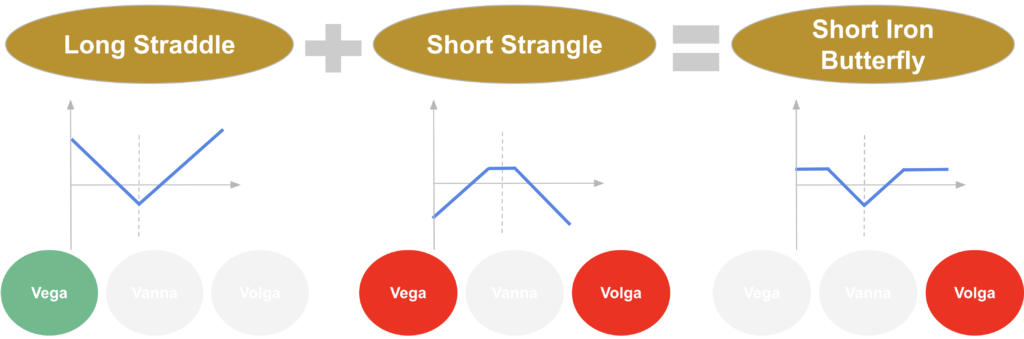
So in total a short iron butterfly which is long a straddle option and short a strangle option would be mostly exposed to the volga risk, so to the vol of vol or tail risk on both sides.
As its volga is negative, the expected volga P&L of a short iron butterfly would be negative as well. So we would expect a positive premium to compensate for that.
It is a simple way to understand why a non-zero volatility of volatility would create a volatility smile with a higher price for OTM options that the strategy is short and a lower price for ATM ones that the strategy is long.

If you wish to deepen your knowledge on the pricing and the risk management of options, you can have a look at our courses (link).
Save 25% on All Quant Next Courses with the Coupon Code: QuantNextBlog25
For students and graduates: We offer a 50% discount on all courses, please contact us if you are interested: contact@quant-next.com
We summarize below quantitative finance training courses proposed by Quant Next. Courses are 100% digital, they are composed of many videos, quizzes, applications and tutorials in Python.
Complete training program:
Options, Pricing, and Risk Management Part I: introduction to derivatives, arbitrage free pricing, Black-Scholes model, option Greeks and risk management.
Options, Pricing, and Risk Management Part II: numerical methods for option pricing (Monte Carlo simulations, finite difference methods), replication and risk management of exotic options.
Options, Pricing, and Risk Management Part III: modelling of the volatility surface, parametric models with a focus on the SVI model, and stochastic volatility models with a focus on the Heston and the SABR models.
A la carte:
Monte Carlo Simulations for Option Pricing: introduction to Monte Carlo simulations, applications to price options, methods to accelerate computation speed (quasi-Monte Carlo, variance reduction, code optimisation).
Finite Difference Methods for Option Pricing: numerical solving of the Black-Scholes equation, focus on the three main methods: explicit, implicit and Crank-Nicolson.
Replication and Risk Management of Exotic Options: dynamic and static replication methods of exotic options with several concrete examples.
Volatility Surface Parameterization: the SVI Model: introduction on the modelling of the volatility surface implied by option prices, focus on the parametric methods, and particularly on the Stochastic Volatility Inspired (SVI) model and some of its extensions.
The SABR Model: deep dive on on the SABR (Stochastic Alpha Beta Rho) model, one popular stochastic volatility model developed to model the dynamic of the forward price and to price options.
The Heston Model for Option Pricing: deep dive on the Heston model, one of the most popular stochastic volatility model for the pricing of options.
In this post we give an introduction to the Heston model which is one of the most used stochastic volatility model. It assumes that the

In the previous post (link) dedicated to the pricing of defaultable bonds with a reduced form model, we saw how to price a zero coupon

The Merton Jump Diffusion (MJD) model was introduced in a previous article (link). It is an extension of the Black-Scholes model adding a jump part