
Volatility & Derivatives
In this post we give an introduction to the Heston model which is one of the most used stochastic volatility model. It assumes that the

In the Black-Scholes model, the volatility of a stock price is assumed to be constant, independent of the strike or time-to-maturity. So if the model was correct, a plot of the Black Scholes volatility implied from option prices with a constant time to expiry, would be a flat line, and the volatility surface would be flat as well.
Volatilities implied by option prices with different strikes or time-to-maturity are different. This is one of the most important limit of the Black-Scholes model.
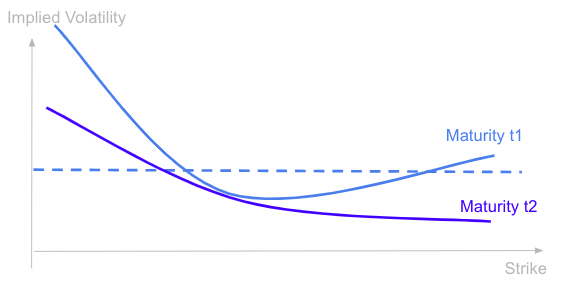
Here is an example with the shape of the volatility implied by options on the S&P as a function of the strike price at two different dates.
We see that the shape look like a smile, particularly for short term options. The volatilities implied by out of the money and in the money options are higher than the volatilities of close to the money options. The typical pattern for equity options is even a volatility smirk, the implied volatility being higher on the left for out-of-the-money put options than on the right for out-of-the-money call options.

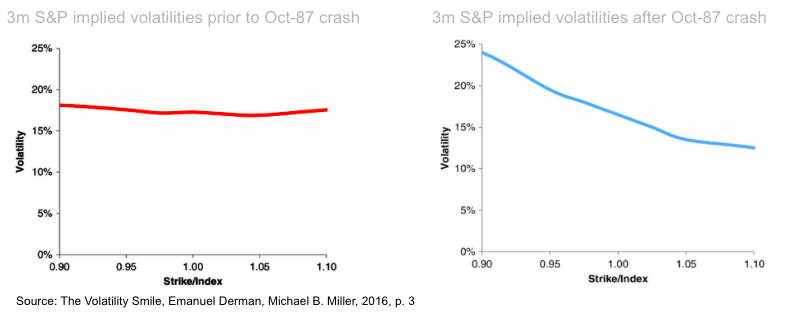
We have started to observe this type of pattern since the market crash of October 87, it was not the case before, the implied volatility curve was actually close to flat, as highlighted in the charts below.
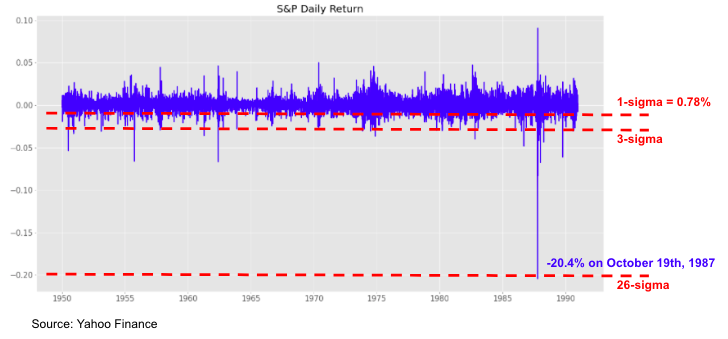
The Black-Scholes model assumes that stock prices are lognormally distributed, however on Monday October 19th 1987 the S&P felt by more than 20%.
The daily volatility of the S&P before October 87 crash was 0.78%, so the daily return of the crash corresponds to a 26 sigma scenario, very far from normal scenarios.
It shows that the geometric brownian motion assumption for the dynamic of stock prices is not true, stocks can jump and their distributions are fat-tailed and the market started to price it after the crash.
A volatility smile is typically a U-shape curve obtained when plotting the volatility implied by option prices as a function of the strike price. Options are on the same underlying asset and have the same expiry date.
The implied volatility increases when the strike of the option is above or below the underlying price.
Such pattern is typically observed for near term options or in some markets where we do not observe a strong asymmetry in the return distribution (e.g. fixed-income, forex).
Investors worry about market jumps, on the upside or on the downside. The return distribution implied by the market is fat-tailed.
They imply a higher probability to have extreme movements on both sides. This can be measured by the fourth moment of the return distribution, its kurtosis.
The volatility smile implies a positive excess kurtosis, meaning that the distribution has fatter tails than a normal distribution.

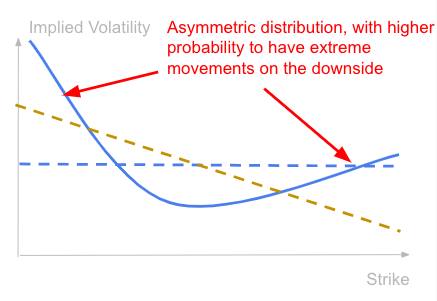
We often observe another type of pattern, with an asymmetric shape, with typically higher implied volatilities for options with lower strikes.
This type of shape is observed on the equity market.
Investors worry for market crash, jumps on the downside, and there is more demand for out-of-the-money put options to protect against it.
The return distribution implied by the market is asymmetric with a higher probability to have extreme movements on the downside.
This is measured by the skewness, the third moment of the return distribution. It measures how asymmetric the distribution is.
A negative skewness means a fatter tail on the left side of the return distribution, so a higher probability to have very negative returns than very positive ones.
Save 25% on All Quant Next Courses with the Coupon Code: QuantNextBlog25
For students and graduates: We offer a 50% discount on all courses, please contact us if you are interested: contact@quant-next.com
We summarize below quantitative finance training courses proposed by Quant Next. Courses are 100% digital, they are composed of many videos, quizzes, applications and tutorials in Python.
Complete training program:
Options, Pricing, and Risk Management Part I: introduction to derivatives, arbitrage free pricing, Black-Scholes model, option Greeks and risk management.
Options, Pricing, and Risk Management Part II: numerical methods for option pricing (Monte Carlo simulations, finite difference methods), replication and risk management of exotic options.
Options, Pricing, and Risk Management Part III: modelling of the volatility surface, parametric models with a focus on the SVI model, and stochastic volatility models with a focus on the Heston and the SABR models.
A la carte:
Monte Carlo Simulations for Option Pricing: introduction to Monte Carlo simulations, applications to price options, methods to accelerate computation speed (quasi-Monte Carlo, variance reduction, code optimisation).
Finite Difference Methods for Option Pricing: numerical solving of the Black-Scholes equation, focus on the three main methods: explicit, implicit and Crank-Nicolson.
Replication and Risk Management of Exotic Options: dynamic and static replication methods of exotic options with several concrete examples.
Volatility Surface Parameterization: the SVI Model: introduction on the modelling of the volatility surface implied by option prices, focus on the parametric methods, and particularly on the Stochastic Volatility Inspired (SVI) model and some of its extensions.
The SABR Model: deep dive on on the SABR (Stochastic Alpha Beta Rho) model, one popular stochastic volatility model developed to model the dynamic of the forward price and to price options.
The Heston Model for Option Pricing: deep dive on the Heston model, one of the most popular stochastic volatility model for the pricing of options.
In this post we give an introduction to the Heston model which is one of the most used stochastic volatility model. It assumes that the

In the previous post (link) dedicated to the pricing of defaultable bonds with a reduced form model, we saw how to price a zero coupon

The Merton Jump Diffusion (MJD) model was introduced in a previous article (link). It is an extension of the Black-Scholes model adding a jump part