


Volatility & Derivatives
In this post we give an introduction to the Heston model which is one of the most used stochastic volatility model. It assumes that the

It is crucial for quant or trading positions to have a strong understanding of the main option Greeks and how they can be used for risk management purposes.
You will find below several questions you could be asked in an interview for a quant or a trading role, with possible answers.
Save 25% on All Quant Next Courses with the Coupon Code: QuantNextBlog25
For students and graduates: We offer a 50% discount on all courses, please contact us if you are interested: contact@quant-next.com
Option Greeks are used to assess and manage the risk associated with options positions. They are key for pricing options, managing risk, and building options strategies effectively in quantitative finance and trading.
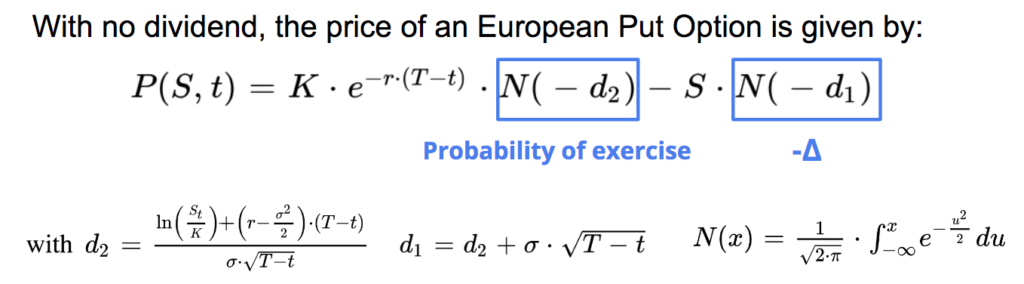
The Black-Scholes price of an option P(t, S, σ, r) is a function of time (t), the stock price (S), the implied volatility (σ) and interest rate (r). Theta (θ), Delta (Δ), Vega (ν), Rho (ρ) are the first order Greeks:
The most important second order Greeks are:
With a second order Taylor expansion of the option value over a short time interval delta t we can decompose the variation of the option price as following.
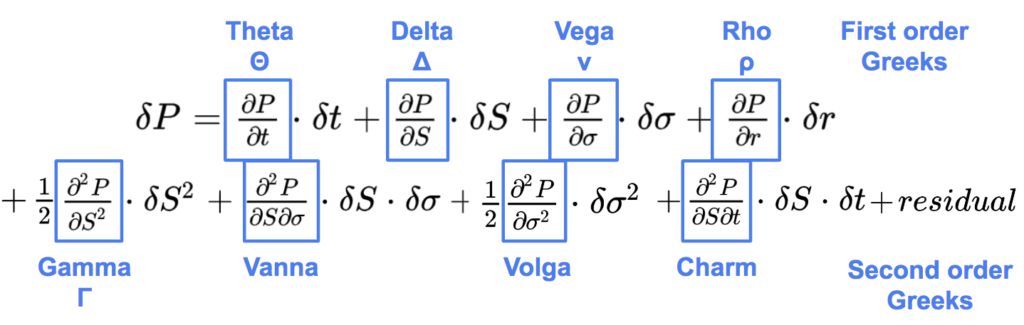
The residual regroups other second order and higher order sensitivities.
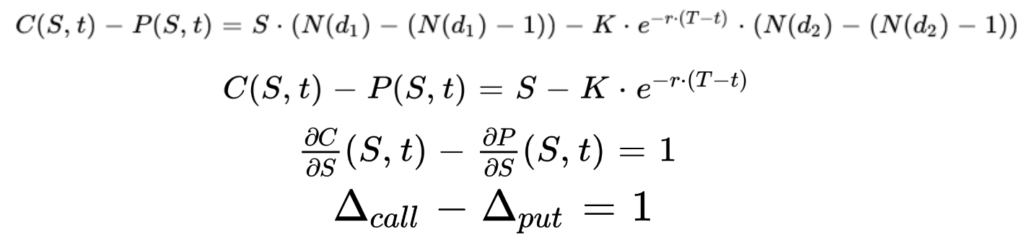
For call options, the Delta is positive. The price of the option increases with the underlying asset price as it becomes more likely to be executed. For put options it is the opposite, the Delta is negative, the price of the put option decreases when the underlying asset price increases as it becomes more out-of-the-money with a lower probability to be exercised.
Theta, Vega, and Gamma behave similarly for both call and put options but may differ in magnitude depending on the specific option contract.
Theta is typically negative for both call and put options. As time passes and the option gets closer to expiry, its premium decreases, the value of the option erodes due to time decay.
Vega is positive for both call and put options. It measures the sensitivity of the option price to changes in implied volatility. As the implied volatility increases, the price of both calls and puts tends to increase.
Gamma, which measures the rate of change of the delta with respect to the underlying asset price is positive for both call and put options. It is a measure of the convexity of the option, it is larger for at-the-money options and it decreases as options are more out-of-the-money.
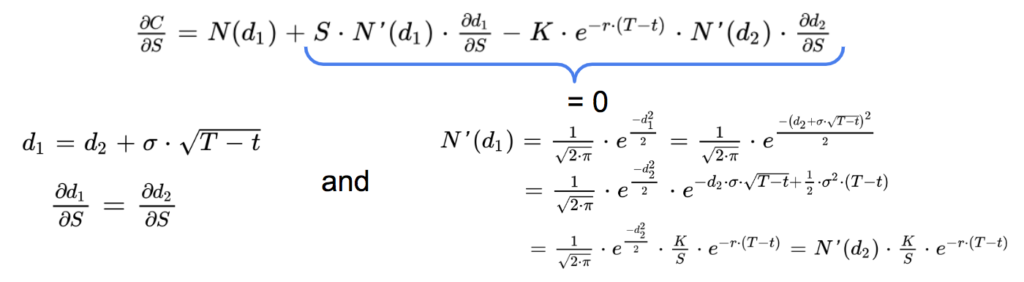
The call option gives the right to buy the underlying asset at a given price K. If the asset price is very close to K, the option is at-the-money (ATM), then it has approximately:
So the delta of an ATM call option close to expire is close to 0.5.
The delta of a call option is higher than the probability that the option will be exercised.
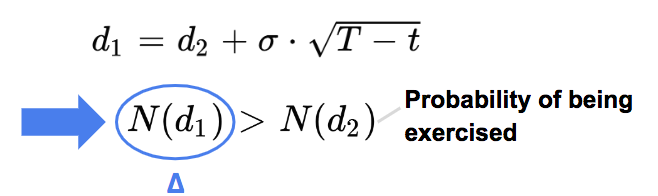
In addition to the probability of being exercised, the delta incorporates by how far the option can be in-the-money.
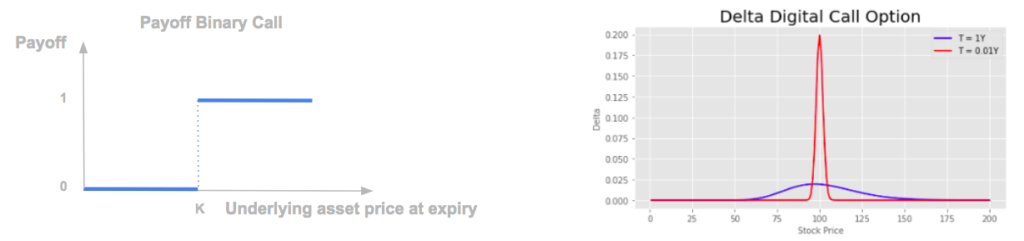
For a digital call option, the delta will tend to zero on the right and on the left of the strike price, while it will tend to infinity at the strike price when the time to expiry tends to zero.
Dynamic Delta-hedging involves continuously adjusting the hedge ratio based on changing market conditions, while static Delta-hedging maintains a constant hedge ratio.
Traders may choose dynamic Delta hedging when they anticipate frequent and significant changes in market conditions, while static Delta hedging can be simpler for more stable markets.
Dynamic delta hedging comes with higher transaction costs, so the trader has to be careful in the frequency of his rebalancing.
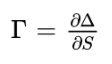
The gamma (Γ) measures the rate of change of the delta (Δ) of an option:
It determines how stable how stable the delta is. A higher gamma means a more important change of the delta when the underlying asset price changes.
It is the second order partial derivative of the value of the option (P) with respect to the price of the underlying asset (S):
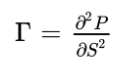
It measures the convexity of the price of the option with respect to the underlying asset price.
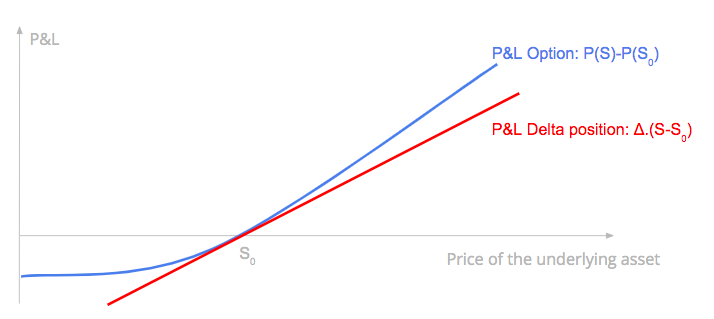
The P&L of a delta-hedged position is the difference between the P&L of the option, and the P&L of the delta position.
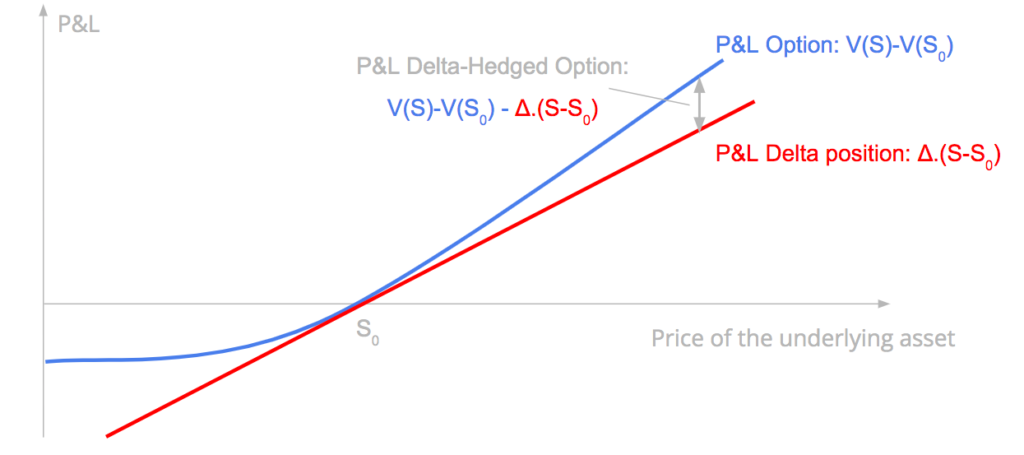
The P&L of a long delta-hedged option position has a quadratic relationship with the change of the underlying asset price at the first order and is a function of the gamma. It means that the strategy is likely to gain if there is a sudden important movement of the underlying asset on the upside or on the downside, and the gain will be at the first order proportional to the gamma of the option.
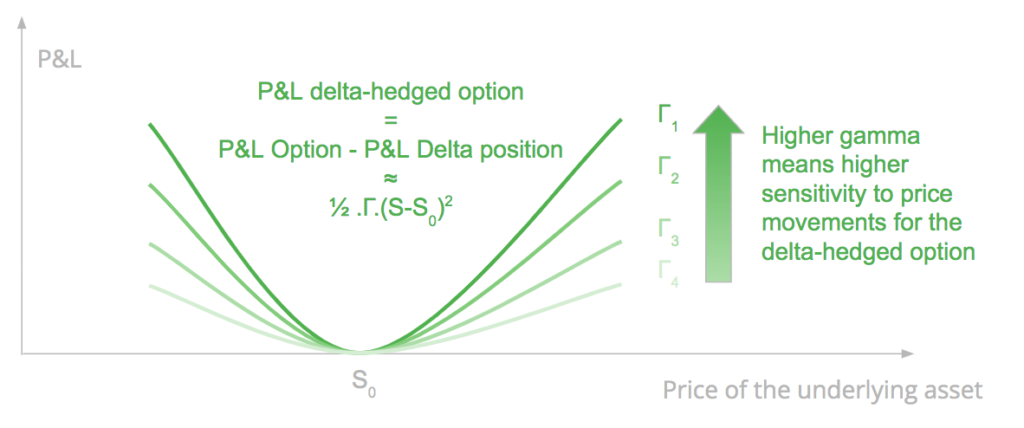
Theta, the time decay of the option, is the cost of gamma. It is the cost for the convexity of the option measured by the gamma.
We have, with σr the realised volatility:
And if we assume that r = q = 0 we have:
So the P&L of the delta-hedged option between t and t + δt is close to:
when neglecting higher order Greeks.
If the implied volatility is higher than the realised volatility, the P&L of the strategy is negative.
The P&L of the long position on the option can be approximated as following, keeping the Delta and Gamma P&L and neglecting other Greeks:
Delta P&L = 0.5 x 5% x 100 = 2.5
Gamma P&L = 1/2 x 0.2 x (5% x 100) ^2 = 2.5
P&L ≈ Delta P&L + Gamma P&L
P&L ≈ 2.5 + 2.5 = 5
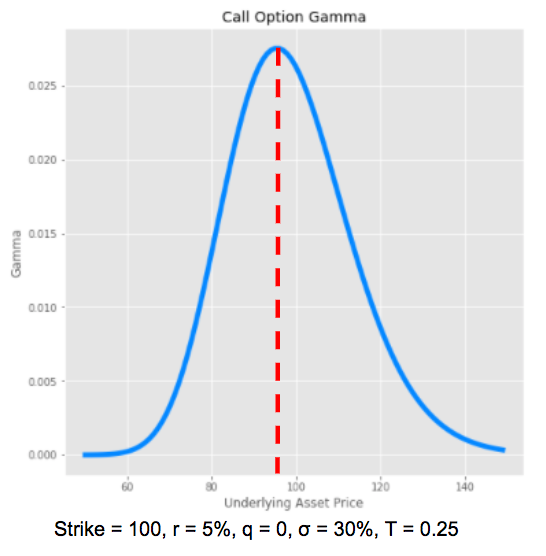
The gamma is maximum when the option is close to the money, when the stock price is close to the strike price, as the option is more convex around the strike price.
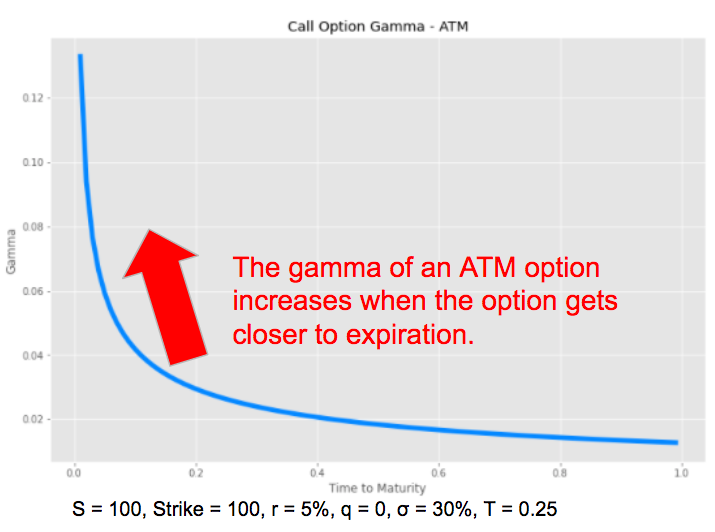
The gamma of an ATM option increases when the option gets closer to expiration. The gamma measures the instability of the delta, which is maximum when the option is at the money and approaches expiry.
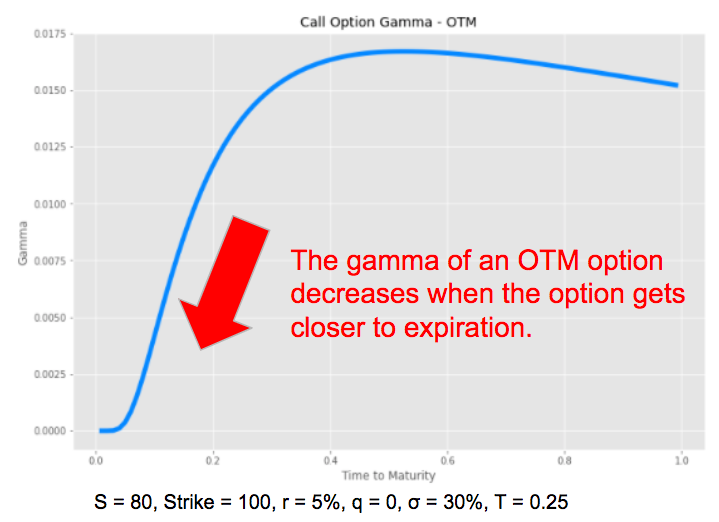
It is the opposite when the option is OTM, the gamma decreases and tends to zero when the option gets closer to expiry.
Via a delta-hedging of the option portfolio, with the underlying asset directly or futures / forwards, we are able to cancel the directional risk, the delta of the portfolio but not the gamma risk. In order to offset the gamma exposure, we need to use another option on the same underlying asset.
First, we determine the quantity of option to offset the gamma. We need to sell 2 options to cancel the gamma (0.01 x 2 = 0.02). The delta of the new option portfolio is 0.5 – 2 x 0.2 = 0.1. So we need to sell this quantity of asset to offset the delta of the new option portfolio.
A risk reversal strategy involves simultaneously buying a call option and selling a put option (long risk-reversal), or vice versa (short risk-reversal), typically with the same expiration date but different strike prices. This strategy is used to speculate on the direction of the underlying asset’s price movement or to hedge exposure to that asset.
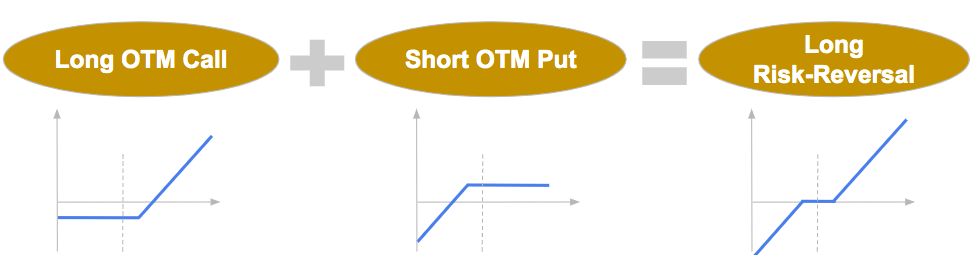
The delta of a long risk-reversal strategy is positive. It is the sum of the delta of a long call position, positive, and a short put position, positive as well.
So we will have to sell the underlying asset in order to offset the delta of the risk-reversal position.
It depends. The gamma of the long call position is positive while the gamma of the short put is negative. So if we structure the strategy such that the two gamma balance each other, the overall gamma will be near zero.
The gamma of the long call will increase as the option will get closer to the money while the gamma of the short put will be less negative, the option being more out-of-the-money. So all-in-all the gamma of the risk-reversal strategy will increase.
The initial gamma of the strategy is close to zero.
When the asset price increases (resp. decreases) and gets closer to the strike of the long call (resp. the short put), the gamma increases (resp. decreases).
The value of the gamma is maximal (resp. minimal) when the asset price is close to the strike price of the call option (resp. the put option).
When the asset price is higher (resp. lower) than the strike price of the call option (resp. put option), the gamma starts to decrease (resp. increase) and converges to zero on both sides.
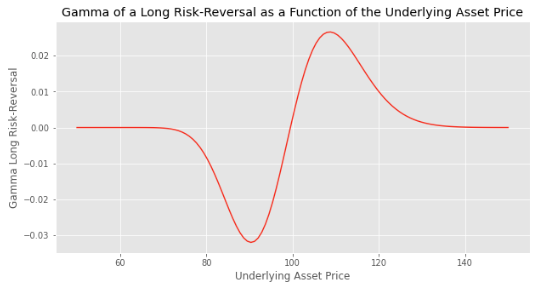
We used the following parameters to plot the chart:
This is very similar to what we did before for the gamma.
The vega of the long call position is positive while the vega of the short put is negative. So if we structure the strategy such that the two vega balance each other, the overall vega will be near zero initially.
When the asset price increases (resp. decreases) and gets closer to the strike of the long call (resp. the short put), the vega increases (resp. decreases).
The value of the vega is maximal (resp. minimal) when the asset price is close to the strike price of the call option (resp. the put option).
When the asset price is higher (resp. lower) than the strike price of the call option (resp. put option), the vega starts to decrease (resp. increase) and converges to zero on both sides.

We used the following parameters to plot the chart:
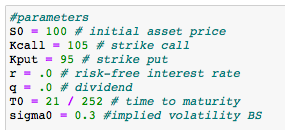
The vanna measures the option’s sensitivity to small changes in the underlying asset price and volatility. It is the sensitivity of the delta to changes in the volatility or the sensitivity of the vega to changes in the underlying asset price.
While both long call and put options have a positive vega, a higher volatility means a higher price, the Vanna is positive in general for OTM call option and negative for OTM put option.
When the option is very OTM its delta decreases in absolute value and tends to zero particularly when the option becomes close to expiry. As the implied volatility increases, the probability that the option moves in the money and that the delta becomes more positive for call options and more negative for put options increases.
So a higher volatility means a higher delta for an OTM call and a lower delta for an OTM put.
A long risk-reversal strategy is the sum of a long call and a short put positions. The vanna of each leg is positive initially, when both options are out-of-the-money, so the vanna of the risk-reversal strategy is positive.
We can see it on the previous chart which shows the vega of the risk-reversal as a function of the asset price. The vanna is the slope of the curve. So we see that it is positive initially, while it will become negative if the call or the put option are in the money.
We used the following parameters to plot the chart:
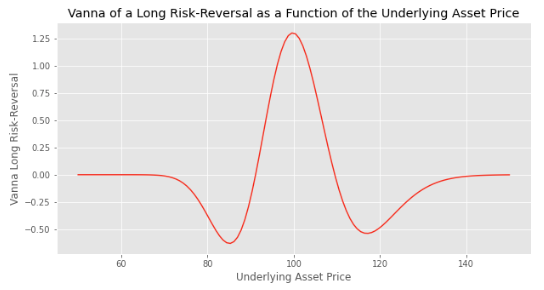
A long straddle is an option strategy where an investor simultaneously purchases both a call option and a put option with the same strike price and expiration date. The main goal of a long straddle is to benefit from significant price movement in the underlying asset, regardless of whether it moves up or down.
If the underlying asset price is close to the strike price at the maturity of the option, the strategy is likely to finish with a loss, close to the premium of the options.
In terms of Greeks, a long straddle has:
The delta of the straddle option initially close to zero would become positive, as the delta (positive) of the long call option, in-the-money (ITM), would be higher in absolute value than the delta (negative) of the put option, out-of-the-money (OTM). You will need to sell the underlying asset in order to hedge it.
A long strangle is a strategy where the investor purchases out-of-the-money (OTM) call and put options on the same underlying asset with the same expiry date. The investor is likely to gain if there is an important movement of the underlying asset on the upside or on the downside. The cost of the strangle option is lower than the cost of the straddle option on the same underlying with the same maturity as it is buying more OTM options.
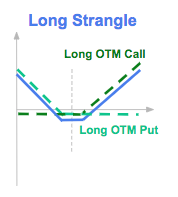
Its Greeks are similar to the long straddle option: low Delta, negative Theta, positive Gamma and positive Vega.
The strategy is buying ATM call and put options and selling OTM put and call options. We draw in blue below the final payoff of the strategy.
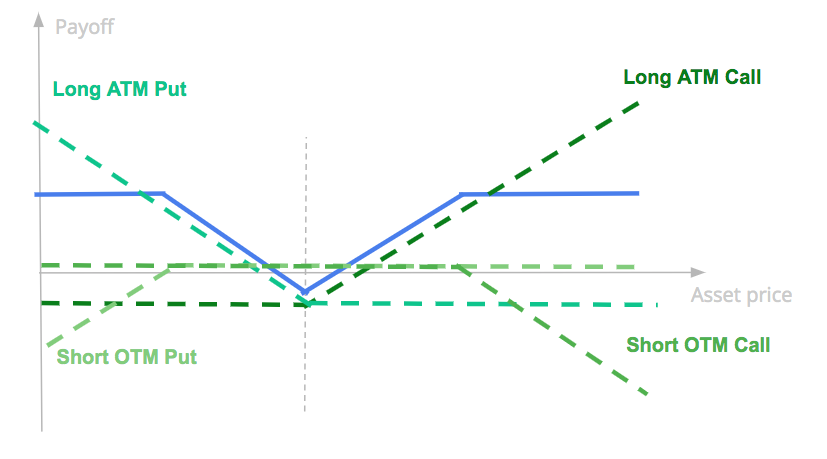
Such strategy is named short iron butterfly.
It has a negative premium if we buy and sell the same number of options, as the cost of the long straddle option is higher than the positive premium of the short strangle option, with strikes more OTM.
Such strategy makes sense for investors betting on asset movements with a certain range, on the upside or on the downside. If the underlying asset does not move, or has a very limited movement it is likely to have a negative P&L as the strategy has a negative premium. If the movement of the underlying asset is high enough, on the upside or on the downside the strategy is likely to post some gains at maturity. But if the underlying asset has an important movement on the upside or on the downside gains are capped.
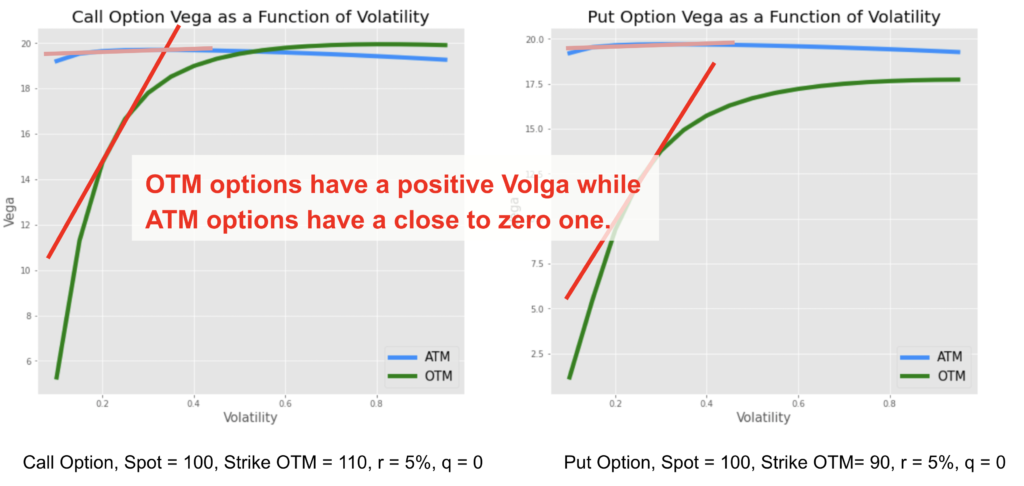
The volga or vomma measures the sensitivity of the vega to a change in the implied volatility. It is the second order partial derivative of the price of the option with respect to the implied volatility.
The volga risk is associated to the risk of important movements of the implied volatility, so to the volatility of volatility, or vol of vol risk. A higher vol of vol means more risk to have important price movements both on the downside or on the upside, so more tail risk on both sides.
When looking at the sensitivity of the vega to changes in volatility, the vega of ATM options is not sensitive to volatility changes meaning a close to zero volga while OTM put or call options have a positive one, the vega increases with volatility. The volga risk, or vol of vol risk is attributed to the wings.
The vega is higher for ATM options than OTM ones. However, an OTM option will be more similar to an ATM one when the implied volatility increases, as it becomes more likely to be exercised. So the vega of an OTM option increases with implied volatility, meaning a positive volga.
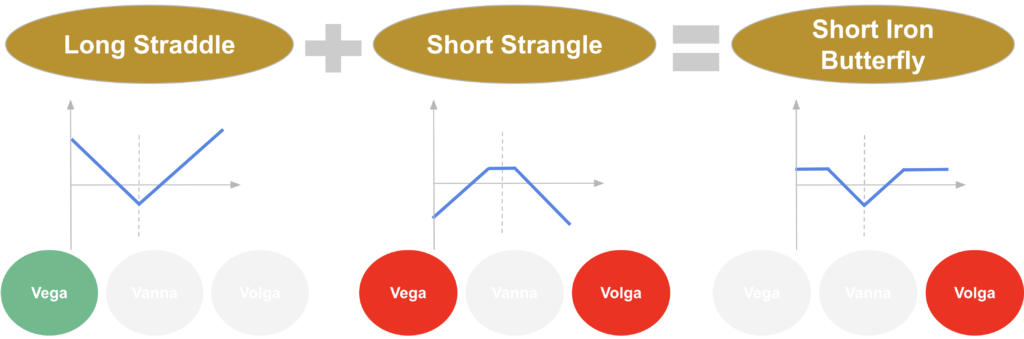
So a strangle option strategy, which is a combination of long OTM call and put options is likely to have a higher volga exposure compared to a straddle option strategy which is a combination of ATM call and put options.
A short iron butterfly strategy will be mostly exposed to the volga risk. The long strangle will have a positive volga exposure, while the short straddle strategy will have a close to zero volga exposure. All other major Greek exposures will be close to zero.
Both strategies will have a close to delta exposure.
The gamma and vega exposure of the long leg and the short leg will offset each other, particularly if we design the strategy to be gamma flat, selling more strangle options to offset the negative gamma of the short straddle.
The vanna exposure, sensitivity of the delta to a change of volatility will be low as well. ATM options have a low vanna exposure. It is not the case for OTM options, but an important part of the negative vanna of the short OTM call will be offset by the positive vanna of the OTM short put.
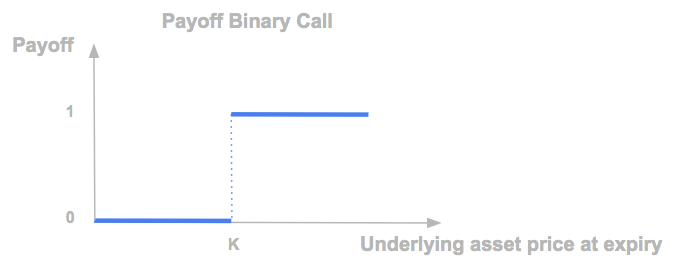
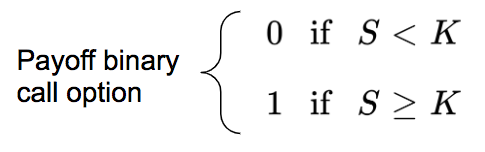
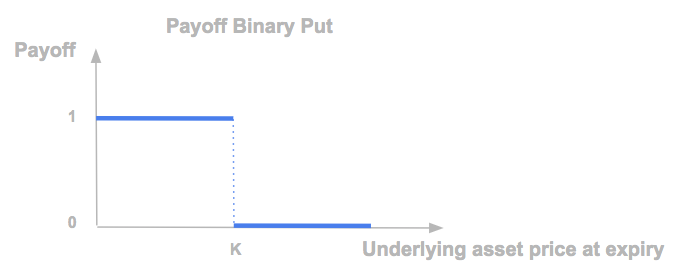
A binary (or digital) cash-or-nothing call option has the following payoff at the maturity of the option, with K the strike price and S the underlying asset. It is equal to 0 if the underlying asset price is below the strike price at maturity, and equal to 1 if it is above.
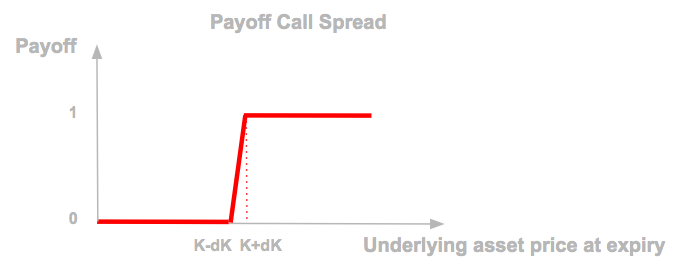
This payoff can be replicated by a call spread buying a call with strike K1 = K – dK and selling a call with strike K2 = K + dK in a quantity equal to 1 / (2 x dK) with dK small enough.
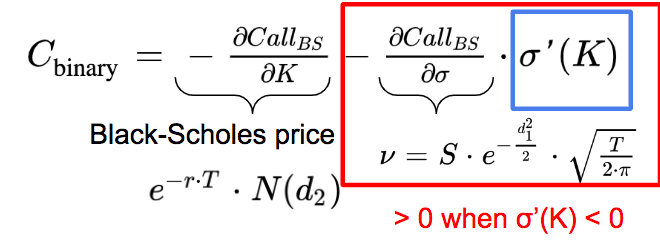
If we assume that the only changing variable is the strike price, the price of a binary call is equal to the opposite of the derivatives of the call price with respect to the strike price:
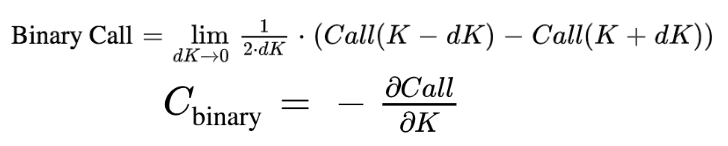
It can be approximated by finite difference as following, with ẟK a small change of K.
The price of the binary call is equal to the probability that the option will be exercised times the discount factor.
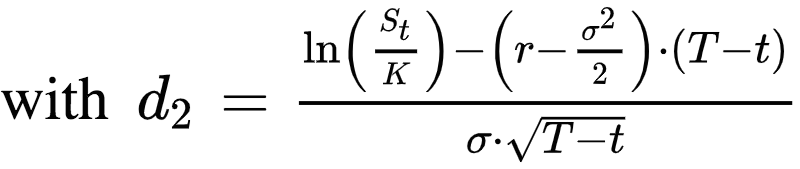
We have:
The price of a binary call is equal to the opposite of the derivatives of the call price with respect to the strike price.
So we obtain the following expression for the price of the binary call option:
The first term is the Black-Scholes price, while the second term is the opposite of the product of the Black-Scholes vega and the derivatives of the volatility with respect to the strike price (the skew), which we assume is negative.
So the price of the binary call option is higher than the Black-Scholes price.
A binary put option can be replicated by a put spread.
If we assume that the only changing variable is the strike price, the price of a binary put is equal to the derivatives of the call price with respect to the strike price:
We assume that the Black-Scholes implied volatility is a decreasing function of the strike price we get:
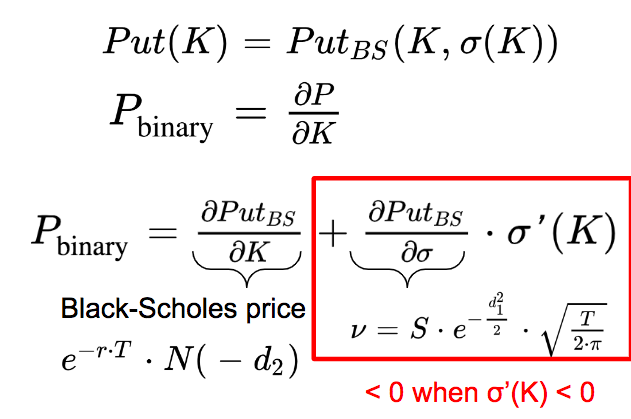
So we see that the price of the binary put option is lower than its Black-Scholes price.
We summarize below quantitative finance training courses proposed by Quant Next. Courses are 100% digital, they are composed of many videos, quizzes, applications and tutorials in Python.
Complete training program:
Options, Pricing, and Risk Management Part I: introduction to derivatives, arbitrage free pricing, Black-Scholes model, option Greeks and risk management.
Options, Pricing, and Risk Management Part II: numerical methods for option pricing (Monte Carlo simulations, finite difference methods), replication and risk management of exotic options.
Options, Pricing, and Risk Management Part III: modelling of the volatility surface, parametric models with a focus on the SVI model, and stochastic volatility models with a focus on the Heston and the SABR models.
A la carte:
Monte Carlo Simulations for Option Pricing: introduction to Monte Carlo simulations, applications to price options, methods to accelerate computation speed (quasi-Monte Carlo, variance reduction, code optimisation).
Finite Difference Methods for Option Pricing: numerical solving of the Black-Scholes equation, focus on the three main methods: explicit, implicit and Crank-Nicolson.
Replication and Risk Management of Exotic Options: dynamic and static replication methods of exotic options with several concrete examples.
Volatility Surface Parameterization: the SVI Model: introduction on the modelling of the volatility surface implied by option prices, focus on the parametric methods, and particularly on the Stochastic Volatility Inspired (SVI) model and some of its extensions.
The SABR Model: deep dive on on the SABR (Stochastic Alpha Beta Rho) model, one popular stochastic volatility model developed to model the dynamic of the forward price and to price options.
The Heston Model for Option Pricing: deep dive on the Heston model, one of the most popular stochastic volatility model for the pricing of options.
In this post we give an introduction to the Heston model which is one of the most used stochastic volatility model. It assumes that the

In the previous post (link) dedicated to the pricing of defaultable bonds with a reduced form model, we saw how to price a zero coupon

The Merton Jump Diffusion (MJD) model was introduced in a previous article (link). It is an extension of the Black-Scholes model adding a jump part